CVSD Budget & Finance
CVSD is committed to accountability and transparency to our community. Monitoring CVSD's financial health and progress, business services provides comprehensive financial reports and resources, including budget status, budget monitoring, and cashflow reports. Public budget work sessions and presentations are held as part of regular school board meetings each spring to facilitate open discussions about fiscal priorities and challenges. Annual state audits uphold CVSD to the highest standards of financial integrity, ensuring responsible stewardship of taxpayer funds.
Updates below serve as an accessible resource, offering real-time insights into CVSD's financial practices.
If you would like to request additional elements be added to this page or are unable to find the information you are interested in, please email communications@cvsd.org.
2025-2026 Budget - Approved June 23, 2025
CVSD's School Board approves the district's annual budget in August of each year. The Board also certifies annual levy amounts for general fund and debt service funds to be collected from taxpayers on the district's behalf by the Spokane County Treasurer's Office.
CVSD’s 2025–2026 General Fund budgeted revenue is $277.3 million. Approximately 82% of the district’s funding comes from the State of Washington and federal programs. The remaining 18% comes from local taxpayers through the Educational Programs and Operations Levy, the Local Effort Assistance (LEA), and other non-tax local sources such as fees, rentals and donations. In addition to the General Fund, the district manages separate funds for capital projects, transportation vehicles, debt service, and Associated Student Body (ASB) activities.
|
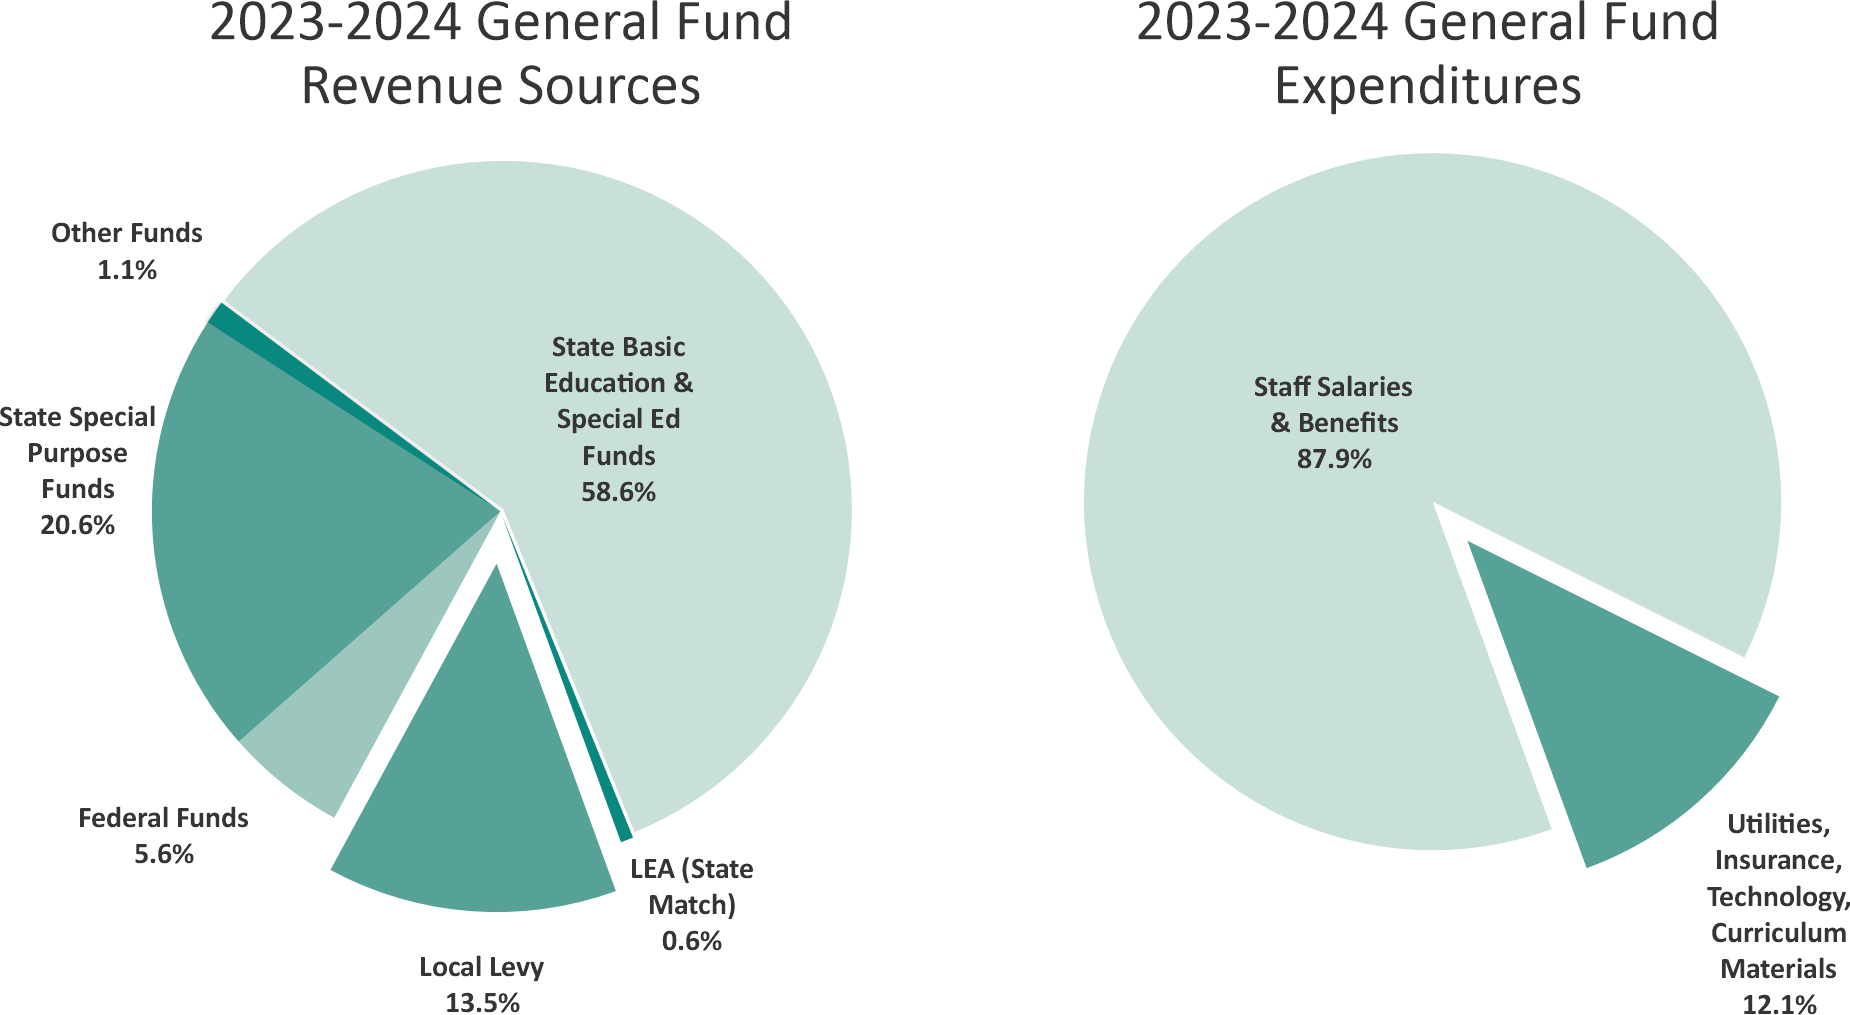
2025-2026 General Fund Revenue Sources |
|
% of Total |
|
State Basic Education & Special Ed Funds |
$152,815,212 |
55.12% |
|
LEA (State Match) |
$4,300,690 |
1.55% |
|
Local Levy |
$44,656,335 |
16.11% |
|
Federal Funds |
$13,152,717 |
4.74% |
|
State Special Purpose Funds |
$59,347,872 |
21.40% |
|
Other Funds |
$2,990,624 |
1.08% |
|
Total General Fund Revenues |
$277,263,450 |
|
2025-2026 General Fund Expenditures |
|
% of Total |
|
Staff Salaries & Benefits |
$231,196,941 |
85.1% |
|
Utilities, Insurance, Technology, Curriculum, Materials |
$40,448,509 |
14.9% |
|
Total General Fund Expenditures |
$271,645,450 |

2025-2026 CVSD Budget - Approved June 23, 2025
2025-2026 Budget Development - May through June, 2025
2025-2026 Budget-Building Parameters - School Board Work Session February 24, 2025
2024-2025 Budget - Approved August 12, 2024
CVSD's 2024-2025 general fund budgeted revenue is $259.3 million. More than 84% of the district’s funding comes from the State of Washington and Federal programs. The remaining revenues, 16%, flow from local taxpayers via the Educational Programs and Operations levy and Local Effort Assistance (LEA). The district also maintains separate funds for capital projects, transportation vehicles, debt service, and Associated Student Body (ASB) activities.

2024-2025 CVSD Budget - Approved August 12, 2024
2024-2025 CVSD Budget Extension - Approved April 14, 2025
2024-25 Budget Reports: September - Current
2023-2024 Annual Financial Report - December 2024
2023-2024 Budget - Approved August 14, 2023
Understanding Enrollment Headcount Versus FTE
CVSD’s 2023-2024 enrollment was 14,112 students via headcount and 13,886 full-time equivalent (FTE) students. This is less than one percent variance from the budgeted projection of 13,974 FTE. However, it is higher than the 13,826-student enrollment from June 2023. FTE enrollment projections drive funding for budget development.

- 2 students = headcount of 2
- Student A: attends all day = 1 FTE
- Student B: attends 1 class on-site & Running Start = 0.18 FTE
|
Headcount |
Full Time Equivalent (FTE) |
|
2 |
1.18 |
Enrollment Projection Process
- District assessment of demographic data
- Roll up students from prior year grades
- Project kindergarten enrollment
- Review special education and alternative programs
K-12 State Standardized School Funding Formula Calculation
- FTE of certificated staff per grade based on an average school population (Elementary 400 FTE; Middle School 432 FTE; High School 600 FTE)
- FTE of administrators and classified support staff (i.e., secretaries, custodians, maintenance, technology, etc.)
- Allocation for maintenance, supplies, and operating costs (i.e,. technology, utilities, curriculum, library materials, supplies, etc.)
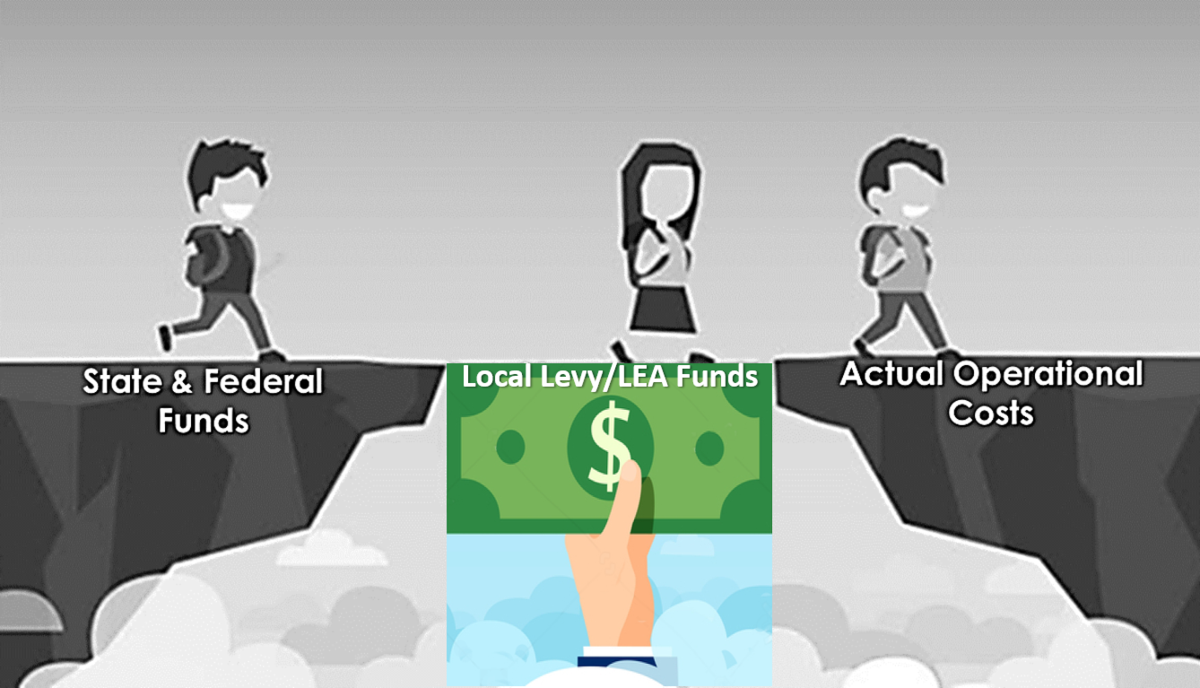
Local Effort Assistance (LEA) State Funding Reduction
LEA provides school districts with state funding for locally determined activities that enrich the state’s program of basic education, in addition to the local levy, thereby enhancing equity in students’ access to extracurricular activities. The LEA funding model recently changed with a significant reduction in the amount allocated for CVSD.

Funding of Certificated Staff

- The state funding model generates certificated FTE staff numbers based on student enrollment projections.
- 2023-2024 state funding model calculated 724.5 FTE certificated teachers
- There is a gap in the state funding versus the actual average cost of compensation and benefits
- $24,940 per FTE certificated teacher
- The estimated excess cost for 724.5 FTE =$18,069,030 (paid by local levy dollars)
- Special education certificated staff (above the 724.5 FTE) are funded through state special education funds.
CONTACT INFORMATION:
- Shannon Johnston, Executive Finance Officer sjohnston@cvsd.org
- Mathew Knott, Director of Business Services mknott@cvsd.org
